6.2 Loops
Loops take the step further by allowing you to automate the use of repeating command lines with the same structure. For example, if you want to import a variable multiple times with different target dates. You can then use the for command in combination with in to define how the loop should iterate. You can either define an interval using a colon (:), or you can list the values it should iterate over. It is possible to use both integers, text and symbols as iterators, and it is possible to iterate over more than one iterator in a loop. Iterators can be seen as a binding that generates a set of values that go from the first to the last value in a loop. Note that iterator bindings are local so you can use the same names in different loops. Also, bindings defined inside a loop are local.
Example of using loops:
 for iterator in 1 2 3
  let double = $iterator * 2
end

for iterator in 1:3
  let double = $iterator * 2
end

for year in 2019 : 2021
  let siv_date = $year ++ "-01-01"
  let siv_year = siv_ ++ $year
  import f/SIVSTANDFDT_SIVSTAND $siv_date as $siv_year
end
A typical analysis example where you import a set of variables measured over several years, for a random selection of resident individuals in a given age group:
 let start_year = 2020
let start_date = date_fmt($start_year + 1)

let minage = 40
let maxage = 50

create-dataset totalpop
import f/BEFOLKNING_FOEDSELS_AAR_MND as birthdate
sample 0.1 12345
generate age = $start_year - int(birthdate/100)

import f/BEFOLKNING_STATUSKODE $start_date as regstat

keep if regstat == '1' & age >= $minage & age <= $maxage
histogram age, discrete freq

//Alternative 1
for i in 2016 : 2020
  let idate = date_fmt($i, 12, 31)
  let yy = $i - 2000
  let var = wage ++ $yy
  import f/INNTEKT_LONN $idate as $var
end

//Alternative 2
for i in 2016 : 2020
  import f/INNTEKT_LONN date_fmt($i, 12, 31) as wage ++ $i - 2000 ++ "_2"
end
Another example where you create three datasets with the same structure, and which retrieves course data measured over the year 2018 for respectively. job seekers, disabled, and social assistance recipients. This is used to find the number of days in the different statuses (during 2018). The datasets are merged with the main dataset "residents" for each step:
 for dbname, vname in ARBSOEK2001FDT_HOVED UFOERP2011FDT_GRAD SOSHJLPFDT_MOTTAK, jobseeker disabled sosial
  create-dataset $vname ++ "data"
  import-event db/$dbname 2018-01-01 to 2018-12-31 as $vname

  let startvar = START@++$vname
  let stopvar = STOP@++$vname
  let daysvar = $vname ++ "_days"

  replace $stopvar = date(2018,12,31) if $stopvar > date(2018,12,31)
  replace $startvar = date(2018,01,01) if $startvar < date(2018,01,01)

  generate $daysvar = $stopvar - $startvar + 1
  collapse(sum) $daysvar, by(PERSONID_1)
  boxplot $daysvar
  summarize $daysvar
  histogram $daysvar, width(30)
  merge $daysvar into residents
end
Yet another example where you retrieve cross-sectional data over working time for all employees measured over all the months in 2018:
 create-dataset employee

for i in 1 : 9
  import db/ARBLONN_PERS_SUM_ARBEIDSTID date_fmt(2018,0+$i,16) as worktime0++$i, outer_join
end

for i in 10 : 12
  import db/ARBLONN_PERS_SUM_ARBEIDSTID date_fmt(2018,$i,16) as worktime++$i, outer_join
end
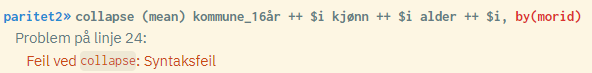
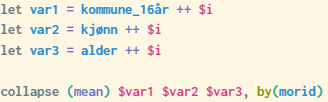
Note that using inline bindings (++) is not compatible with the collapse() command. Therefore, you should use bindings through the use of let in conjunction with collapse() operations.
Example that doesn't work:
Use this solution instead:
Other commands that are not compatible with inline bindings: aggregate, recode, and reshape-to-panel.
Complete introduction script for bindings and loops can be found here (can be pasted into the script window in microdata.no and run).
Practical example where you connect siblings to a dataset using loops - you can find it here.